Grounded in experience, driven by curiosity.

01.

Hello, I am Virginia Levy Abulafia.
I enjoy digging into messy problems until they make sense.

I’m a data analyst with a non-linear background and a deep curiosity for how things work and why.
From raw data to insight using Python, SQL, R, and BI tools

02.

My Tools

  1. LANGUAGES: Python · R · SQL
  2. LIBRARIES & TOOLS: Pandas · Matplotlib · Seaborn · Folium · Scikit-learn
  3. BI & WORKFLOW: Tableau · Looker Studio · BigQuery · Excel · Google Sheets
  4. EXTRAS: Prompt Engineering · Generative AI · APIs
From raw data to insight using Python, SQL, R, and BI tools.

03.

Projects

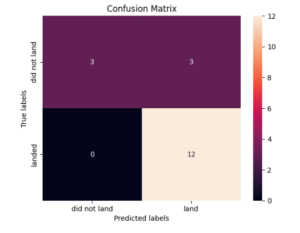
Falcon 9 First-Stage Landing Prediction

Because rocket science can wait, this is data science.

Excecutive Summary

  • Challenge
    Predicting rocket landings to cut launch costs for a SpaceX rival.
  • Approach
    Used API + web scraping to build a clean dataset and train ML models.
  • Outcome
    SVM nailed it. The dashboard displays launch success by site and payload.
  • Reflections
    Framing the problem mattered more than fancy models.

Designed for Desire

Data-driven analysis of cultural and commercial trends in sex toys.

A strap-on dildo being used by two women. Lithograph from De Figuris Veneris (1906) by Édouard-Henri Avril

  • Challenge
    Map evolution and consumer behavior across brands, usage types, and countries.
  • Approach
    Web scraping, manual classification, and cultural analysis in Python.
  • Outcome
    Cultural analysis of more than 100 products and 4 brands across 3 continents.
  • Reflections
    From static insights to interactive storytelling.

Agent_Meme

Because crafting a clever LinkedIn comment shouldn’t take longer than reading the post.

  • Challenge
    Crafting witty LinkedIn comments is tough. Agent-Meme automates it with AI, humour, and style.
  • Approach
    Built a Python agent using Chato GPT-4o and DALL-E to generate and visualize smart meme replies.
  • Outcome
    Created customizable, downloadable memes while learning to integrate APIs and handle text/images quirks.
  • Reflections
    Prompting is a creative skill, true control came from framing, iterating, and guiding AI intentionally.

BLQ Airport Dashboard

An interactive dashboard that tracks 25 years of air traffic at Bologna Airport. 

Passenger Traffic: Bologna vs National Avg

  • Challenge
    Visualize 25 years of air traffic.
  • Approach
    Built with Dash and Plotly on top of prior analysis.
  • Outcome
    Live dashboard on passengers, cargo, CO2 and delays.
  • Reflections
    A hands-on exercise in merging public datasets, handling time series gaps, and building a responsive UI with Dash.

Bologna Airport Operational Analysis

End-to-end Python analysis on flight traffic, data cleaning, and performance metrics.

ATC_vs_Slot_Delay_per_1000_pax_Summer
  • Challenge
    50+ datasets with inconsistent formats and IDs.
  • Approach
    End-to-end Python pipeline for cleaning and alignment.
  • Outcome
    Insights on delays, traffic trends, and emissions efficiency.
  • Reflections
    Real-world data is messy, governance makes it usable.

Wine Quality – Comparative Data Cleaning

A two-part technical project focused on cleaning, validating, and comparing wine quality data using R and Python.

pH_comparison
  • Challenge
    Cleaning and validating red & white wine data using domain-specific rules.
  • Approach
    Built R and Python workflows to detect outliers, check variable ranges, and compare insights.
  • Outcome
    Improved dataset reliability, highlighted quality issues, and applied regulatory logic.
  • Reflections
    Planning the structure of a project before writing any code is essential.

Cyclistic – Bike-Sharing Analysis

Analyzing historical trip data on a leading bike-share company.

Frequency of Rides Across Diff. Times of the Day

• Challenge
Cyclistic needed insights to convert casual riders into annual members.

• Approach
Cleaned and analyzed trip data in R to identify usage trends across user types.

• Outcome
Found behavioral differences supporting targeted promotions and service planning.

• Reflections
Data preparation was key: cleaning, documentation, and consistent formatting enabled accurate, actionable insights.

04.

Working Process

  1. I listen to find the core. I ask questions to see the need (and the data!) beneath it.
  2. I build. Fast, focused, and flexible. Sketches, scripts, dashboards, stories, whatever the project needs.
  3. I test, refine, and simplify.
  4. I deliver something that speaks clearly. Something that fits, just work that connects.

Contact me

This is not just a career shift: it’s everything I’ve learned, reshaped.

Torna in alto